Android Graphic Analyzer (AGA) version 0.5.0 product tour
Toolkeen™ Android Graphic Analyzer (AGA) provides Real-Time OpenGL
usage and performance analysis inside Eclipse IDE.
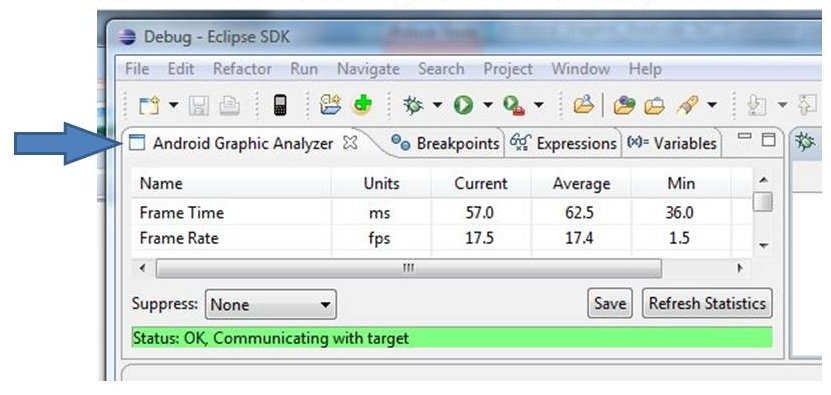
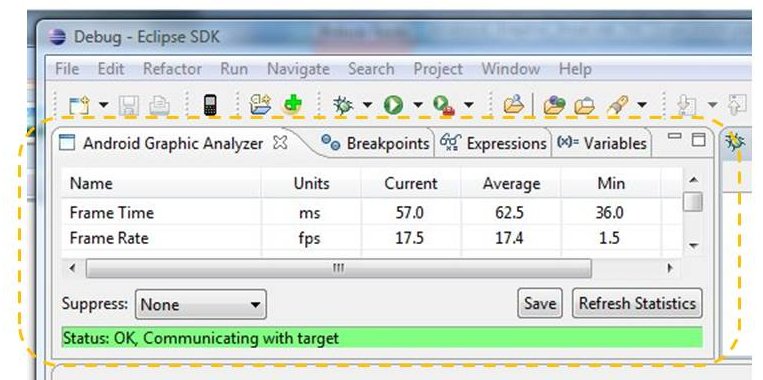
AGA Plugin is integrated seamlessly into the same Eclipse development
environment that is used to develop the Android application, There is
no need to switch applications to use the AGA. The view is dockable to
every edge, can be pinned, tabbed or hidden and resized like any other
Eclipse view and is seen below side by side with the breakpoints,
variables and other debug views.
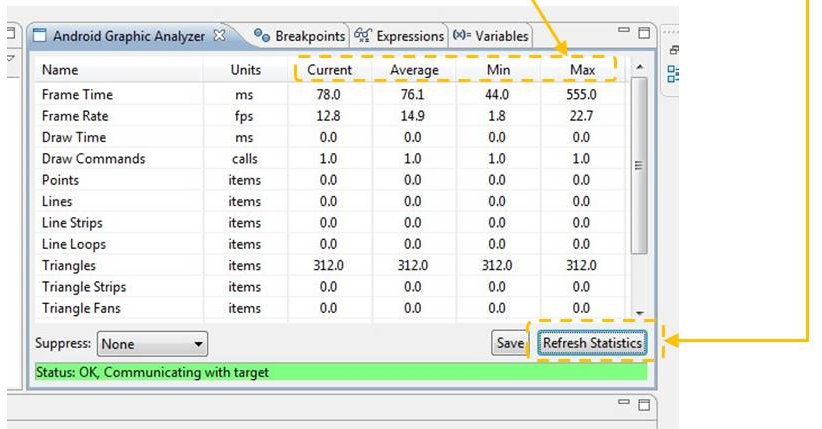
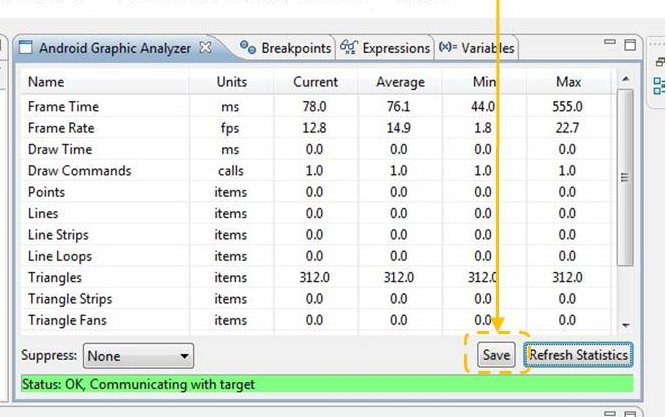
The top part of the view displays Real-Time performance Statistics. The
statistics include the current value, average, minimum and
maximum of every measurement AGA keeps track of. The statistics
collection can be restarted when the developer wants to
measure a different scene by pressing the "Refresh Statistics" button.
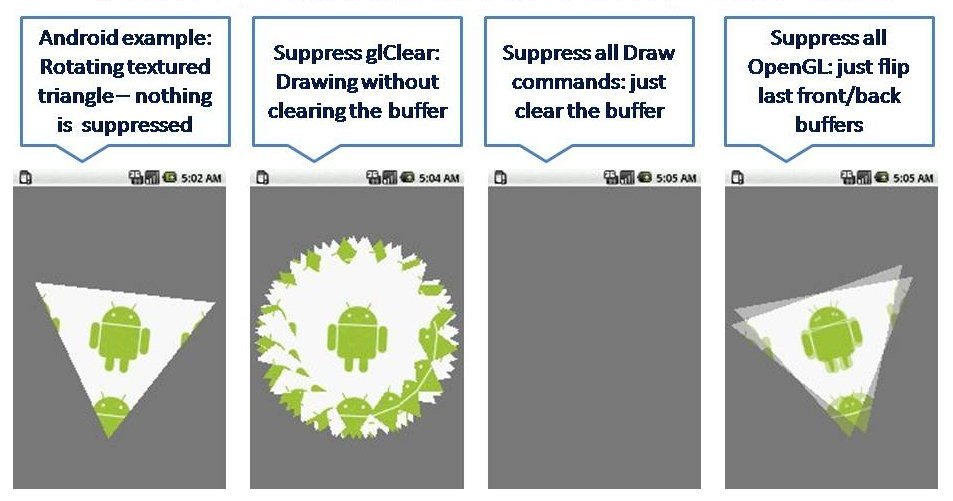
Various “suppress” modes allow detection and isolation of graphic
performance bottlenecks. Without
changing anything in the application.
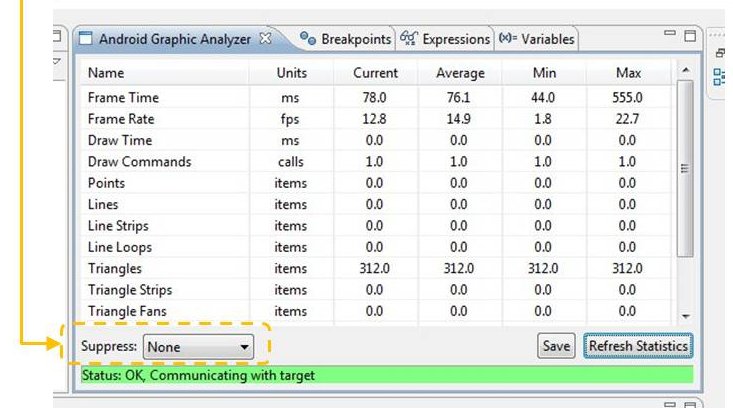
Suppress modes allow isolating the impact of certain OpenGL activities
on overall performance. The next image shows the effect of suppressing
various parts of the
OpenGL API as applied to the Android SDK example of rotating textured
triangle. The application code was not altered to produce the following
visuals:
The statistics can be exported to text files and comma delimited files
(CSV) for inclusion in reports and spreadsheet analysis. Especially for
highlighting the difference achieved by a change in a certain 2D/3D
scene. The save dialog is reached by the save button shown below.
What would you like to see next?
Send Questions, Comments and Wish-Lists to info@toolkeen.com